Multiple Plate Quantitative Assay
There are a number of different ways that standards and samples of a quantitative assay might be arranged across multiple plates. The MyAssays layout editor allows you to specify for each plate:
1. How samples are arranged
2. Which standards measurements should be used to construct a standard curve
3. Which curve to use to calculate concentrations from
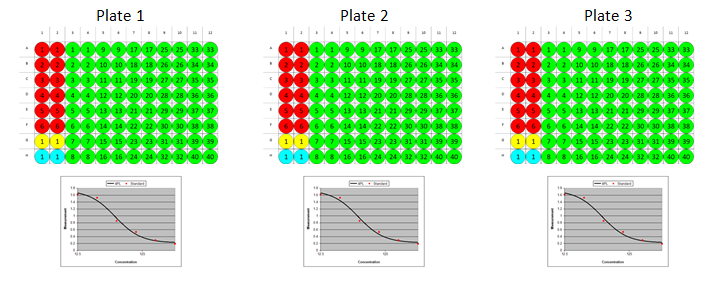
The most common scenario is to measure standards on each and every plate in the batch. For example, in the following illustration, 3 plates are read, each uses the same layout, a curve is created for each plate and concentrations are calculated using the standard curve on the same plate as each sample.
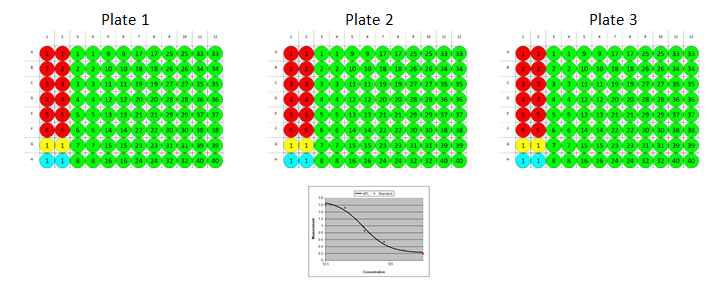
Another common scenario is to measure standards on some or all plates in the batch and generate a single standard curve using standard replicates from across separate plates. In this case sample concentrations for all plates are calculated using the single common curve.
In the following illustration, 3 plates are read, each uses the same layout and a single curve is created use the standard measurements from each plate. The common standard curve is then used to calculate concentrations for all samples on all plates.
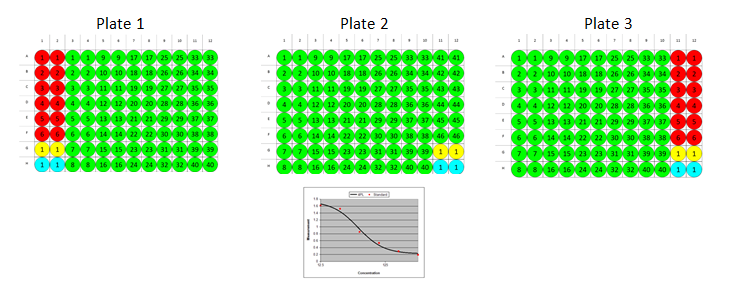
MyAssays also supports using a different layout on each plate read. In the following illustration, 3 plates are read, with each plate using a different sample arrangement. Here a single curve is created using the standard measurements from the first and last plate in the batch.
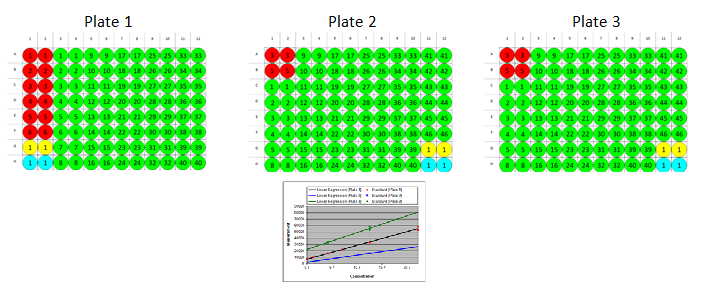
Also, MyAssays allows you to measure all standards on one plate and only a subset of standards on other plates (partial standard groups).
The system will overlay the curves generated for each plate so that you can manually inspect whether each curve is in comparison to the curve generated from the full range of measured standards.
In the following illustration 3 plates are read, the first plate measures the full range of standards, whereas the second and third plates only measure a subset of the standards, the resulting report shows the curve fit for each plate for visual comparison.
This is explained in more detail here.
Less typically, you might want to combine these options and configure a multiple plate layout which uses a specific curve or common curve on a plate-by-plate basis.