Zero Concentration Standard
Many commercial kits include a standard of zero concentration and kit manufacturers often recommend plotting a 4PL curve fit through all of the standards. This can cause some problems and confusion with data analysis.
Firstly, concentration values are almost always in a non-linear sequence and will typically be plotted on a logarithmic x axis. A zero point cannot be seen on a logarithmic axis.
Secondly, the resulting fit might be skewed and result in a fit that does not appear to be a good fit.
For example, the following chart shows a fit through 6 standards where the first standard is zero concentration (0) and is not visible.
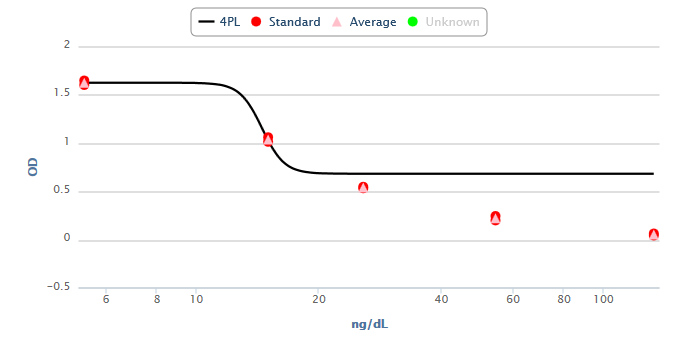
In this case the fit through the 5 visible points is not usable and is confusing.
The easiest and most common approach to handle this scenario is to specify the concentration of the zero standard as a suitably small non-zero value instead of 0. In this example, using 0.1 would work result in the following fit:
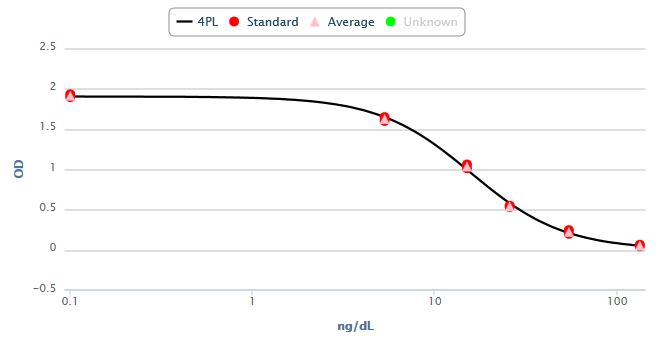
This small change results in a greatly improved fit. Also, viewing this chart we can perhaps more clearly see what went wrong when a 0 value is used for the zero standard with the 4PL fit. As you can see from this chart, for each decade the left most point is shifted (i.e. 0.1, 0.01, 0.001, etc.) the point moves further away from the other points. A value of 0 is actually a very long distance from the other points and this caused the skewed fit in the first chart above.
For purists that would like to use a zero standard and treat it as 0 with a 4PL fit there are alternative tools available on MyAssays.com. Please contact support for more details.