Cubic Regression
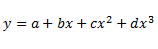
Calculation instructions for many commercial assay kits recommend the use of a cubic regression curve-fit (also known as 3rd order polynomial regression). The cubic regression equation is:
Cubic regression should not be confused with cubic spline regression.
Cubic regression is useful when the line through plotted data which curves one way and then the other.
However, one problem with using cubic regression with assay analysis is that the determined curve might feature a turning point inside the range of the standards rendering parts of the curve unusable for concentration calculations.
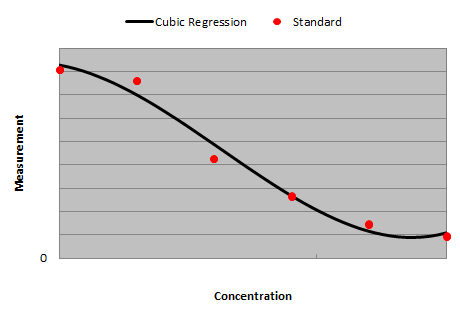
For example, the cubic regression curve-fit through these standards appears initially acceptable:
However, on closer inspection of the curve between the two highest concentration standards we can see a turning point:
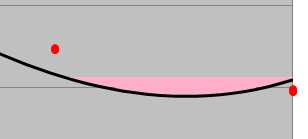
This turning point means that the curve cannot be used to interpolate concentration values for measurements within the range highlighted in pink. This is because the results are ambiguous (here there would be two possible concentrations for any measurement).
If there is no turning point within the range of the standards then there will certainly be a turning point outside the range of the standards and it is for this reason that cubic regression cannot be used to extrapolate. This means that if any of your samples fall slightly outside the range of your standards then a concentration cannot be calculated.
To avoid these problems with cubic regression, we recommend the use of the four parameter logistic fit (4PL) of five parameter logistic fit (5PL). Here is a 4PL fit through the same data points:
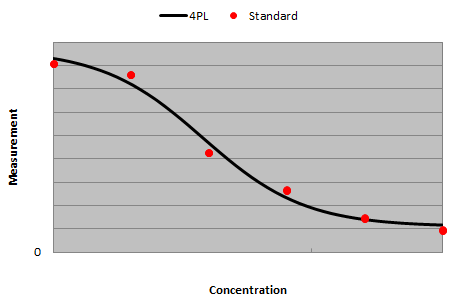
The sigmoidal nature of the 4PL equation eliminates any possibility of turning points ensuring the widest possible usable curve range.
Compare the fits yourself with your own data using the curve fitting resources available at:
• Cubic Regression
• Four Parameter Logistic Curve
• Five Parameter Logistic Curve