Four Parameter Logistic Curve Report
The 4PL curve report generated by the tool at http://www.myassays.com/four-parameter-logistic-curve.assay comprises of the following elements (click item to jump to explanation):
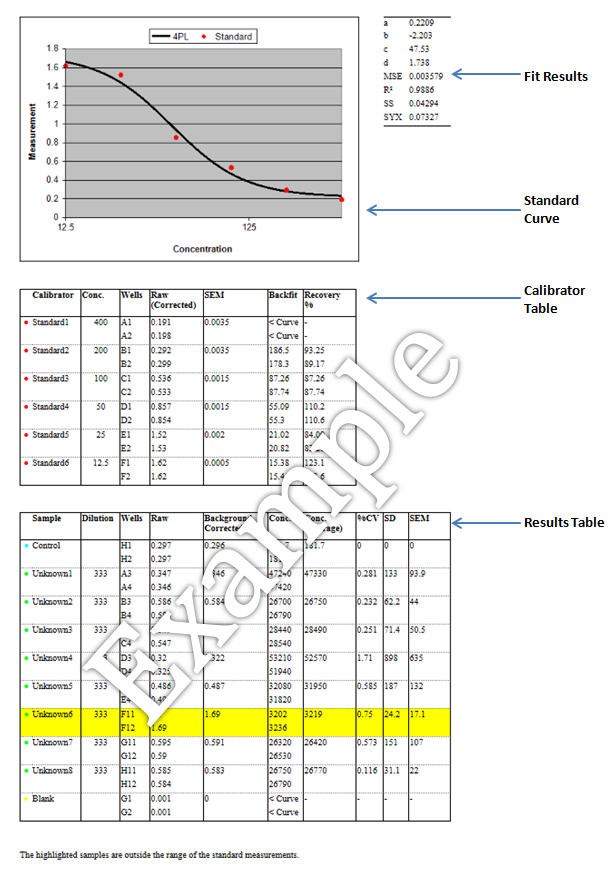
Standard Curve
The Standard Curve plots the standard data points (red dots) on a semi-log axes with the measured values versus the specified concentrations. (The logarithmic x-axis is used for the concentrations and the linear y-axis shows the measurements.)
The thick black line shows the curve calculated from these standards. Here the curve is the result for the Four Parameter Logistic (4PL) fit.
Fit Results
The Fit Results table lists:
• The calculated four parameters of the 4PL (the coefficients a,b,c and d)
• The Goodness of Fit Measures:
- • MSE – The Mean Square Error. (The closer to zero, the better the fit.)
- • R² - This is 1 minus the ratio of SS / (the sum of the squares of the differences between Y fit and the mean Y value). This will equal 1 for a good fit (SS = 0) and tend towards 0 for a bad fit.
- • SS - The sum of the squares of the residuals (errors). (The closer to zero, the better the fit.)
- • SYX - The standard deviation of the residuals. This is the square root of (the sum of the squares of the residuals divided by (number of data points – number of coefficients)). (The closer to zero, the better the fit.)
Calibrators Table
The Calibrators Table lists the details of the standards used to generate the Standard Curve. For each calibrator, the following details are listed:
• Calibrator - Sample Name (e.g. Standard1)
• Conc. - Specified concentration (from the Standard Concentrations in the calculation page).
• Wells - The positions on the layout designated as containing the sample
• Raw - The raw measured data (if a blank group is used this reports the corrected value which is the sample measurement minus the average of the blank)
• SEM - Standard Error of the Mean
• Backfit – This is the raw data interpolated using the curve to calculate the concentration. This should compare favourably with the specified concentration of the standard. For the lowest or highest standard it is often this is because the accuracy of the curve is poor (see Additional Notes)
• Recovery % - The percentage recovery is the ratio between the known concentration and the backfit (i.e. observed/expected). Where the curve fit perfectly models the biochemistry there will be 100% recovery. This measure indicates the accuracy of the curve at each standard point.
Results Table
The Results Table lists the details of the calculations for each of the samples. For each sample, the following details are listed:
• Sample – The Sample Name, e.g. Unknown1. For unknown samples the name will be replaced by any provided Sample ID (under Sample IDs section in the calculation page).
• Dilution - The Dilution Factor. For unknown samples, if the samples was diluted then this value lists the specified dilution. (From Dilution Factors section in the calculation page).
• Wells - The positions on the layout designated as containing the sample (as provided in the Microplate section).
• Raw – The raw measurement values (as provided in the Measurements section).
• Background Corrected - If a blank group is used this column is included and reports the corrected value which is the Raw measurement minus the average of the Blank1 group.
• Conc. –The concentration calculated by interpolating the measurement (raw or background corrected) on the Standard Curve. If the sample has diluted, the reported concentration is the value read from the standard curve multiplied by the specified dilution.
• Conc. (Average) – The average of the concentrations calculated for the sample.
• %CV – The percentage coefficient of variation. Typically assay samples are replicated and the %CV is useful for measuring the deviation between the replicates. The %CV is calculated for each sample as the % of the standard deviation (SD) of the replicate measurements divided by their mean. Typically for replicates one might expect a %CV value to be < 15. A value greater than this might indicate a preparation or layout error. Acceptable limits depend on the application.
• SD – Standard Deviation of the sample population.
• SEM – Standard Error of the Mean.
Samples in the table will be highlighted for one of the following reasons:
• outside the range of the standard calibrator. In this case a concentration may be reported although it is an extrapolated value rather than interpolated.
• outside the range of the curve (see Additional Notes).
In either case it is recommended that highlighted samples are diluted and re-assayed.
Additional Notes
A concentration or backfit result may be reported as:
< Curve – this means that the measured value is lower than the lower asymptote of the 4PL. This usually indicates that the sample was too concentrated to give an accurate result.
> Curve – this means that the measured value is greater than the upper asymptote of the 4PL. This usually indicates that the sample was too dilute to give an accurate result.
The 4PL is a sigmoidal curve with upper and lower asymptotes (reflected by the a and d coefficients of the fit). Thus, the 4PL curve can only be used to calculate results for measurements within the Y ranged defined by the a and d coefficients. The curve cannot be used to interpolate results outside this range.
The nature of the 4PL means that the accuracy of the interpolated reduces as measurement values get closer to the asymptotes (i.e. a small change in the measurement results in a large change in the calculated concentration). Thus, for samples which are close to the asymptotes, it is recommended that those samples are diluted and re-assayed.